

So, the big news in medical AI research is that the Stanford ML group under Andrew Ng has released a paper on chest x-ray interpretation that claims human performance at identifying pneumonia.
First up, very cool!
Second up, I have concerns. Vague and not so vague discomforts.
So, after having a few days to wrap my head around the paper, here is some of my reactions. Note that I will review this paper more thoroughly at a later date as part of my “end of human doctors” series, but for now I wanted to dive in a little bit. This will be a mostly medical discussion, but I promise it will be an important one for anyone who works with medical data. I should also point out that the majority of this discussion isn’t about the Stanford work, but instead is about the publically available dataset from the NIH team of Wang et al.
Full disclosure, cards on the table and all of that: my team has a paper where we claim radiologist level performance at a clinical task dropping on arXiv next week. I hope that nothing I say that follows is seen as trying to diminish the work of Rajpurkar et al. or Wong et al. If either team wants to get in touch, I am happy to make updates to this post with new information and correct any errors 🙂
How to beat a doctor
One of my most popular blog posts has been “Do machines actually beat doctors?” In it I explain the difference between a clinical task and a non-clinical task, why that matters, and give a guide to identify when news articles are making fair comparisons with human experts.
It boiled down to these questions:
- is it a clinical task?
- Is it deep learning in a big dataset?
- Is the article misrepresenting the research?
So very briefly, in reverse order:
3. I am looking at the primary research, so this isn’t relevant.
2. Yes! It is deep learning, and the dataset is ~109,000 cases. I’ve previously mentioned a rule of thumb (that is adapted from Andrew Ng in the first place) that you need around 1000 training examples of what you want to learn before you will get near human performance. This is a very loose rule, but it is a good ballpark. The ChestXray14 dataset has over 2000 cases of “pneumonia”, and in fact apart from their “hernia” class (n = 284), every label has over 2000 examples. The largest class, “infiltration”, has 25,000.
So far so good.
1. Here is the issue. Is detecting pneumonia on chest x-ray a clinical task?
Cloud watching
Simple answer: no, it is not. Pneumonia is a mostly clinical diagnosis, and there are very few specific signs that an abnormality on chest x-ray is pneumonia as opposed to other common pathologies. Let me explain.
Pneumonia is an infection in the lungs. This means a pathogen, like bacteria or a virus, has set up shop and is causing trouble. In most cases, trouble means swelling and pus. On a chest xray, this usually means you get fluid in the airspace (ignoring interstitial change for the moment). When the air (low density) is replaced by fluid (higher density), you get white clouds on the x-ray, otherwise known as consolidation.
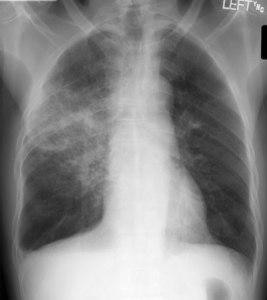
A cloudy opacity in the right upper lobe (x-rays are always viewed with the patient looking towards you, so the left side of the image is the right side of the person)
So, let’s look at things that can make clouds in the lungs. From Radiopaedia (the best resource about radiology around, it is free and better than most textbooks):
The exhaustive list of all possible causes would be huge, but a useful framework includes:
- pus, i.e. infection
- bacterial pneumonia
- fungal pneumonia
- viral pneumonia
- atypical pneumonia
- aspiration pneumonia
- fluid
- blood
- pulmonary contusion
- pulmonary haemorrhage
- anticoagulation
- bleeding diathesis
- Goodpasture syndrome
- emboli
- pulmonary embolism (PE)
- fat embolism
- amniotic fluid embolism: usually bilateral
- cells
So here is my first concern. It isn’t about the paper by Rajpurkar et al., it is about the dataset. The NIH team of Wang et al. distinguish between pneumonia and consolidation. Radiologically, this is almost always impossible. Pneumonia is a type of consolidation, the type where the airspace is filled with pus. Pneumonia ⊂ consolidation.
I checked this in my local hospital data. There are about 30,000 occurrences of the word “pneumonia” in chest x-ray reports, in and about half of these (15,000) the word “consolidation” is also used.
But in ChestXray14 they don’t co-occur! With over 2000 cases of pneumonia, there are only 114 co-occurances with consolidation (data here).
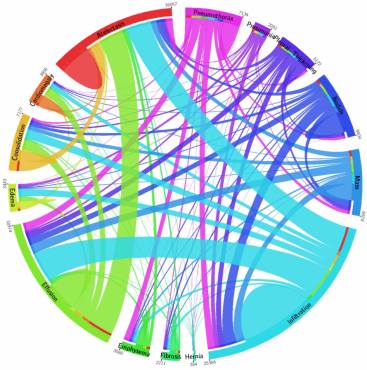
The co-occurrences in the ChestXray14 dataset
So, I am very confused about what the pneumonia label means in this dataset. It should be practically impossible to distinguish pneumonia from consolidation visually, so for deep learning systems it should be almost impossible to learn. Despite this, Rajpurkar et al. report ROC AUC levels of between 0.76 and 0.8 for pneumonia and consolidation.
It gets more confusing. Consolidation is part of a larger superset, usually termed “airspace opacities”. White areas in the lungs, essentially. Pneumonia ⊂ consolidation ⊂ opacity. Now, airspace opacities have two main flavours – consolidation and collapse. If consolidation is the airspace filled with fluid, collapse is the airspace with the air removed. This can happen when the airway is blocked by mucous or a peanut, for example. The distinguishing feature is that in collapse, the lung shrinks.
But unfortunately they co-occur, and the lung shrinking can be very subtle. In most circumstances, they are indistinguishable. One of the most common phrases used in chest x-ray reporting is “collapse or consolidation”. In fact, in my dataset over half of reports that contain the word consolidation also contain the word collapse (90,000 out of 140,000). Now, this matters, because there is another phrase in this dataset – atelectasis. This is just a fancy word that means collapse. Usage of this term varies geographically, but I had a look through the first few hundred examples of “atelectasis” in the ChestXray14 dataset, and just under half of them are indistinguishable from consolidation (to me*). In their labels, there are 16,057 cases of atelectasis, but co-occurence with consolidation is only seen in 1222.
But there is more confusion in the labels, because there is another term in the data: infiltration. This is a pretty rare term where I work (and more widely if this Twitter comment from Dr Deng is anything to go by), but it generally means “airspace opacity”. Almost a quarter of the ChestXray14 cases have this label.
Since the usage is a bit strange, I dove back in to the images of the dataset, and in the first few hundred over half are visually indistinguishable from consolidation (to me*). But in the dataset, the co-occurrence is less than 25% for each of pneumonia, consolidation, and atelectasis.
What this boils down to is that atelectasis, consolidation, infiltration, and pneumonia all look like clouds. Despite this, the degree of label overlap is very low, and deep learning systems seem to have moderate success at distinguishing them. I remain confused.
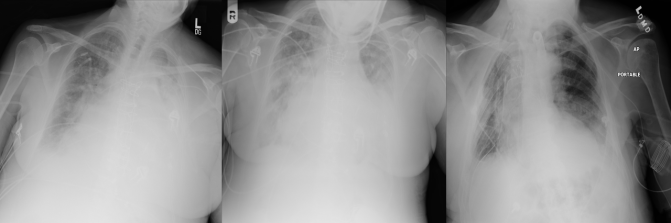
Three fairly representative cases from ChestXray14, labelled from left to right: infiltration, consolidation, atelectasis.
The mess that is clinical data
Some of these issues are an artefact of radiological practice. The terms are roughly interchangeable, and radiologists are unlikely to be able to distinguish pneumonia from other opacities with any level of confidence, given only the x-ray. But since there is no underlying ground truth here, the label pneumonia probably doesn’t mean what it sounds like it means. This is the problem with a lot of clinical data: it is based on (flawed) human interpretation. I favour targets for machine learning which have a highly accurate ground truth for this reason – disentangling the sources of error in clinical datasets is a Herculean task, if it is possible at all.
There are some other minor issues with this dataset:
- They used text mining in the radiology reports to get the labels. So even accepting the confusing labels, the NIH team estimates they are only 90% accurate compared to the original reports (which they are unable to release for privacy reasons). I am going to look into this in more detail, but my preliminary glance might suggest the label accuracy is a fair bit lower.
- They also have lots of x-rays from the same people, often ten or more films taken across several days. These x-rays are almost indistinguishable from each other, and have very similar labels. So teams need to be very careful that there is no crossover with the same patients in their training and test sets. Failure to do this would massively inflate results. It isn’t clear in the Rajpurkar et al. paper if they avoided this pitfall, they just say they randomised their train and test sets for the comparison against previous work.
So what does this all mean for the paper by Rajpurkar et al. that claims human level performance in pneumonia detection?
Well, I don’t know. Reading the paper, it seems like the test they did against humans was in a different dataset:
“We collected a test set of 420 frontal chest X-rays. Annotations were obtained independently from four practicing radiologists at Stanford University, who wereasked to label all 14 pathologies in Wang et al. (2017).”
I still don’t understand how a radiologist can label atelectasis, consolidation, pneumonia, and infiltration as separate things, but I can believe that this dataset might be more consistent than the data in ChestXray14. The fact they have similar performance to humans is a worthwhile result, but I remain uncomfortable about any claims of clinical relevance.
I will dive into the paper more deeply another time, but I don’t want to do more in this post than raise some questions about the dataset. I want to be clear that I am not criticising the work of either team in this piece, both have contributed significantly with their research. I am suggesting that the dataset is not necessarily directly comparable to clinical practice (I am sure the authors of Wang et al. would agree with me), and that in particular the diagnosis of pneumonia using this data makes me uncomfortable.

I wonder about your point 2: What empirical evidence is the 1,000 samples rule of thumb based on? If it’s based on the ImageNet task, then the equivalence seems tenuous. For example, we examined how many samples you might need to do a binary classification task in another clinical image dataset, and found that you might need fewer samples:
https://www.biorxiv.org/content/early/2017/10/01/196659.1
I believe this has to do with the fact that the images occupy a tiny sub-space of the input space, making the number of effective parameters needed much smaller. Looking for evidence of AMD in a retinal image is a very different task than classifying many classes of objects in natural images.
LikeLike
I think it depends on the task, but a thousand is a good rule of thumb. In my experience, on anything a human find even remotely challenging, and given significant clinical variability in quality, technique and so on for most medical images, a thousand is a minimum, and you won’t reach a limit on performance without much more data.
LikeLike
The article is very well written, easy to follow and informative. Thank you. Looking forward to reading your previous posts on AI
LikeLike
I think it is noteworthy that the paper is published on a non-peer-reviewed site. Additionally, while radiologists seem to have contributed peripherally, by reading the sample set, the rest of the paper, including the conclusions, comes from the AI side. Those predicting doom and gloom for radiology, including Ng, Hinton, Zeke Emmanuel, et. al., are NOT radiologists, and I submit don’t have a complete grasp of what we do.
LikeLiked by 1 person
There have been many cases of peer reviewed papers being shamelessly bogus, so being peer reviewed is not necessarily a bulletproof argument for or against non peer reviewed papers. Besides, as you point out, if it had been peer reviewed it would most likely had been reviewed by IT professionals more than by radiologist so it would have not added much value to it. I believe in the era of the interwebs, the true review gets done by attentive people like the doctor above who can understand both fields and contribute with a very valuable informed opinion in both areas.
LikeLike
Good observations and thanks for the detailed discussion on the clinical inseparability of pneumonia, consolidation and opacity. Another observation with the labels of the NIH data is in the longitudinal studies of the patient, it seems some of the chronic diseases like emphysema, cardiomegaly are going in and out for the same patient. Though the chronology in the reports/labels are not meaningful, but still the way the normal and these diseases are spread for the same patient makes us wonder, how reliable the labels are. I am not a clinical expert and would like to get clinical insight on that.
LikeLiked by 1 person
Hi Das, I think this is a really good observation, and something I have noticed too. I am investigating further, expect another post in the future.
LikeLike
Hi Luke, your project is very inspiring and promissing for future. Do you know Emergency Medical Holoprogram (EMH) from Star Trek Voyager series? This technology is gonna be invented in Sci-fi world of Star Trek in 2370 year. What is your opinion for this sort of project? 🙂
LikeLike
I liked your comment, I created holograms back in the early 1990’s and have some in several in museums, for example National Museum of Health and Medicine and MIT:
https://webmuseum.mit.edu/detail.php?module=objects&type=browse&id=5&term=Folio%2C+Les&page=1&kv=72097&record=0&module=objects
Feel free to email me at Les.Folio@nih.gov
LikeLike
Hi Luke,
I am a radiology resident at Brown and had the exact same issues with this paper that you nicely outlined here. I am currently on my thoracic rotation and I have to say there are only a handful of times where I am able to come down hard and say that the opacity I see is definitely a pneumonia. 99% of the time the typical differential is given “aspiration, atelectasis or pneumonia.
It is clear that the paper (and for that matter, the lab where the paper came from) does not have any MDs, which I think is a necessary component to any AI project within the medical realm.
LikeLiked by 1 person
They actually have 3 radiologists on the paper, and one of them is thoracic specialised. I’m not jumping to conclusions about the validity of the dataset or this paper. I’ll let you know when I know more.
LikeLike
I am a radiologist at the NIH clinical center where the images originated.
I agree with your comments; I would like to share mine directly with you with a group looking into this before posting conclusions. Can you contact me directly at Les.Folio@nih.gov
LikeLike
I’ve sent you an email. Cheers
LikeLiked by 1 person
I noticed that the data has been collected from 32,717 unique patients, with the disease labels text-mined from the associated radiological reports, using NLP techniques. I am assuming that some of the CXRs are, therefore, from follow-up visits. Also, the images are randomly split into train, validation, and test sets. Under these circumstances, I truly believe, there is a possibility that the follow-up CXRs from the same patient would find its way into the validation and test collections. This would result in “biasing” the network so that instead of learning the “task-specific” features, the network may “memorize” the images, since it finds images in the test collection that are highly similar to instances in the training and validation data. Under these circumstances, the network may not “generalize” to unseen data. Correct me if I’m wrong though 🙂
LikeLike
This is a possibility, and an issue I am investigating. I am in contact with the relevant teams, and I’ll have an update when possible 🙂
LikeLike
Thanks for the detailed insights from a clinical perspective regarding the different abnormalities. The source of the test set is mentioned in an updated version of the paper:
“To estimate radiologist performance, we collect annotations from four practicing academic radiologists on a subset of 420 images from ChestX-ray14. On these 420 images, we measure performance of individual radiologists and the model.”
LikeLike