

Anyone who has read my blog or tweets before has probably seen that I have issues with some of the common methods used to analyse the performance of medical machine learning models. In particular, the most commonly reported metrics we use (sensitivity, specificity, F1, accuracy and so on) all systematically underestimate human performance in head to head comparisons against AI models.
This makes AI look better than it is, and may be partially responsible for the “implementation gap” that everyone is so concerned about.
I’ve just posted a preprint on arxiv titled “Docs are ROCs: A simple off-the-shelf approach for estimating average human performance in diagnostic studies” which provides what I think is a solid solution to this problem, and I thought I would explain in some detail here.
Disclaimer: not peer reviewed, content subject to change 🙂
A (con)vexing problem
When we compare machine learning models to humans, we have a bit of a problem. Which humans?
In medical tasks, we typically take the doctor who currently does the task (for example, a radiologist identifying cancer on a CT scan) as proxy for the standard of clinical practice. But doctors aren’t a monolithic group who all give the same answers. Inter-reader variability typically ranges from 15% to 50%, depending on the task. Thus, we usually take as many doctors as we can find and then try to summarise their performance (this is called a multi-reader multicase study, MRMC for short).
Since the metrics we care most about in medicine are sensitivity and specificity, many papers have reported the averages of these values. In fact, a recent systematic review showed that over 70% of medical AI studies that compared humans to AI models reported these values. This makes a lot of sense. We want to know how the average doctor performs at the task, so the average performance on these metrics should be great, right?
No. This is bad.
The problem with reporting the averages is that human sensitivity and specificity live on a curve. They are correlated values, a skewed distribution.

What do we learn in stats 101 about using averages in skewed distributions?

In fact, this practice has been criticised many times in the methodology literature. Gatsonis and Paliwal go as far as to say “the use of simple or weighted averages of sensitivity and specificity to draw statistical conclusions is not methodologically defensible,” which is a heck of an academic mic drop.

What do you mean?
So we need an alternative to average sensitivity and specificity.
If you have read my blog before, you would know I love ROC curves. I’ve written tons about them before (here and here), but briefly: they visually reflect the trade-off between sensitivity and specificity (which is conceptually the same as the trade-off between overcalling or undercalling disease in diagnostic medicine), and the summary metric of the area under the ROC curve is a great measure of discriminative performance. In particular the ROC AUC is prevalence invariant, meaning we can compare the value across hospitals even if the rates of disease differ.
The problem is that human decision making is mostly binary in diagnostic medicine. We say “there is disease” or “there is no disease”. The patient needs a biopsy or they don’t. We give treatment or not*.
Binary decisions create single points in ROC space, not a curve.
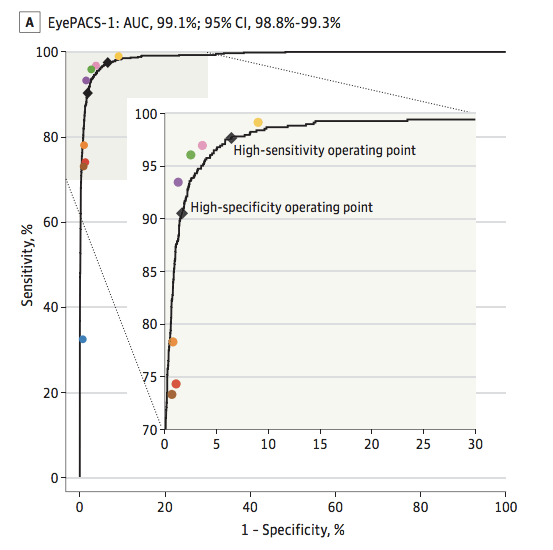
AI models on the other hand make curves. By varying the threshold of a decision, the same model can move to different places in ROC space. If we want to be more aggressive at making a diagnosis, follow the curve to the right. If we want to avoid overcalls, shift to the left.
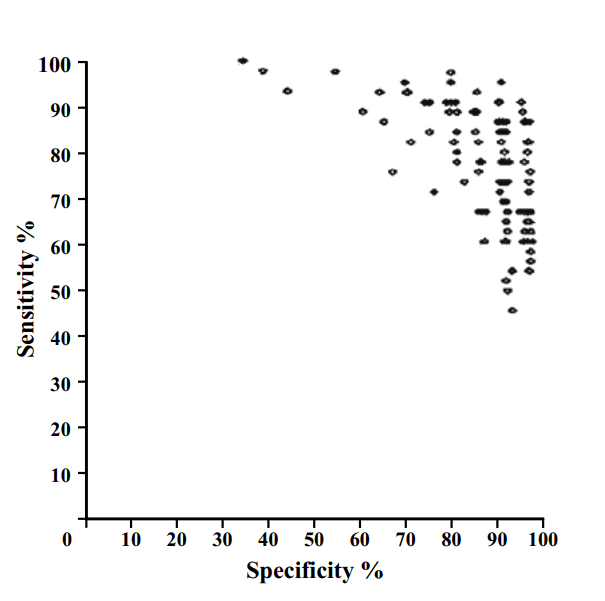
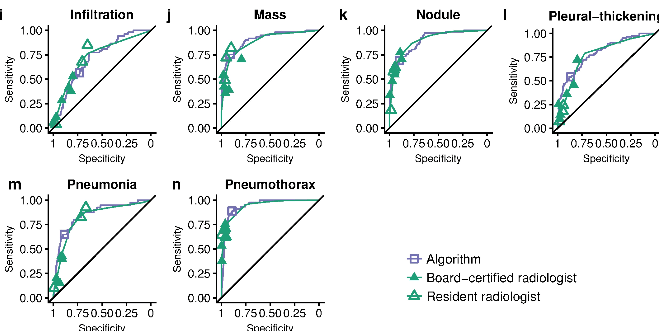
As these examples show, groups of humans tend to organise into curves. So why don’t we just … fit a model to the human points to characterise the underlying (hypothetical) curve?
I’ll admit I spent quite a long time trying various methods to do this, none of which worked great or seemed like “the” solution.
One day I was discussing this troubling issue with my stats/epi prof, Lyle Palmer, and he looked at me a bit funny and was like “isn’t this just meta-analysis?”.

I feel marginally better about not realising this myself since it appears that almost no-one else has thought of this either**, but dang is it obvious in hindsight.
Wait … what about all those ROCs of docs?
Now, if you read the diagnostic radiology literature, you might be confused. Don’t we use ROC curves to estimate human performance all the time?
It is true, we do. We can generate ROC curves of single doctors by getting them to estimate their confidence in their diagnosis. We then use each confidence level as a threshold, and calculate the sensitivity and specificity for each point. If you have 5 confidence levels, you get a 5 point ROC curve. After that there are established methods for reasonably combining the ROC curves of individual doctors into a summary curve and AUC.
But what the heck is a doctor’s confidence in their diagnosis? Can they really estimate it numerically?

In almost all diagnostic scenarios, doctors don’t estimate their confidence. They just make a diagnosis*. Maybe they have a single “hedge” category (i.e., “the findings are equivocal”), but we are taught to try to avoid those. So how are these ROC curves produced?
Well, there are two answers:
- It is mammography/x-rads, where every study is clinically reported with a score out of 5, which is used to construct a ROC curve for each doctor (ie the rare situation where scoring an image is standard clinical practice).
- It is any other test, where the study design forces doctors to use a scoring system they wouldn’t use in practice.
The latter is obviously a bit dodgy. Even subtle changes to experimental design can lead to significant differences in performance, a bias broadly categorised under the heading “laboratory effects“.
There has been a fair bit written about the failings of enforced confidence scores. For example, Gur et al report that confidence scores in practice are concentrated at the extreme ends of the ranges (essentially binary-by-stealth), and are often unrelated to the subtleness of the image features. Another paper by Gur et al highlights the fact that confidence scores do not relate to clinical operating points, and Mallet et al raise a number of further problems with using confidence scores, concluding that “…confidence scores recorded in our study violated many assumptions of ROC AUC methods, rendering these methods inappropriate.” (emphasis mine)

Despite these findings, the practice of forced confidence scoring is widespread. A meta-analysis by Dendumrongsup et al of imaging MRMC studies reported that confidence scores were utilised in all 51 studies they found, including the 31 studies on imaging tasks in which confidence scores are not used in clinical practice.
I reaaaaally hate this practice. Hence, trying to find a better way.
Meta meta meta

So what did Lyle mean? What does meta-analysis have to do with estimating average human reader performance?
Well, in the meta-analysis of diagnostic test accuracy, you take multiple studies that report the sensitivity and specificity of a test, performed at different locations and on different populations, and you summarise them by creating a summary ROC (SROC) curve.

Well, it seems to me that a set of studies looks a lot like a group of humans tested on a diagnostic task. Maybe we should try to use the same method to produce SROC curves for readers? How about Esteva et al, the famous dermatology paper?

This is a model that best fits the reader results. If you compare it to the average (which was reported in the paper), you see that the average of sensitivity and specificity is actually bordering on the inner 95% CI of the fitted model, and only 4 dermatologists perform worse than the average by being inside that 95% CI line. It certainly seems like to SROC curve makes more sense as a summary of the performance of the readers than the average does.
So the approach looks pretty good. But is it hard? Will people actually use it?
Is it even research?
I initially just thought I’d write a blogpost on this topic. I am not certain it really qualifies as research, but in the end I decided to write a quick paper to present the idea to the non-blog-reading community.
The reason I felt this way is that the content of the paper is so simple. Meta-analysis and the methods to perform meta-analysis is one of the best understood parts of statistics. In fact, meta-analysis is generally considered the pinnacle of the pyramid of medical evidence.
But this is why the idea is such a good solution in my opinion. There is nothing fancy, no new models to convince people about. It is just good, well-validated statistics. There are widely used packages in every major programming language. There are easily accessible tutorials and guidelines. The topic is covered in undergraduate courses.
So the paper isn’t anything fancy. It just says “here is a good tool. Use the good tool.”
It is a pretty short paper too, so all I will do here is cover the main highlights.
What and why?

In short, a summary ROC curve is a bivariate model fitted on the logit transforms of sensitivity and specificity. It comes in two main flavours, the fixed effects model and the random effects model, but all the guidelines recommend random effects models these days so we can ignore the fixed effects versions***.
When it comes to the nuts and bolts, there are a few main models that are used. I reference them in the paper, so check that out if you want to know more.
The “why do meta-analysis?” question is important. There are a couple of major benefits to this approach, but the biggest one by far is that we get reasonable estimates of variance in our summary measures.
See, when you average sensitivity and specificity, you calculate your standard deviations by pooling the confusion matrices across readers. Where before you had multiple readers, you now have one uber-reader. At this point, you can only account for variability across samples, not readers.

In this table, adapted from Obuchowski in a book chapter I wrote, we see that the number of readers, when accounted for, has a huge impact on sample size and power calculations. Frankly, not taking the number of readers into account is methodologically indefensible.
SROC analysis does though, considering both the number of readers and the “weight” of each reader (how many studies they read). Compare this SROC curve re-analysing the results of Rajpurkar and Irvin et al to the one from Esteva et al above:

With only 4 readers, look how wide that confidence region is! If we draw a vertical line from the “average point” it covers a sensitivity range between 0.3 and 0.7, but in their paper they reported an F1 score of 0.387, with a 95% CI of 0.33 to 0.44, a far narrower range even accounting for the different metric.
Another nice thing about SROC curves is that they can clearly show results stratified by experience level (or other subgroups), even when there are lots of readers.

There are a few other good points of SROC curves which we mention in the paper, but I don’t want to extend this blog post too much. Just read the paper if you are interested.
Just use SROCs!

That’s really all I have to say. A simple, off-the-shelf, easily applied method to more accurately summarise human performance and estimate the associated standard errors in reader studies, particularly of use for AI human-vs-machine comparisons.
I didn’t invent anything here, so I’m taking no credit^, but I think it is a good idea. Use it! It will be better^^!
You wouldn’t want to be methodologically indefensible, right?
* I’ll have more to say on this in a future post, suffice to say for now that this is actually how medicine works when you realise that doctors don’t make descriptive reports, they make decisions. Every statement made by a radiologist (for example) is a choice between usually two but occasionally three or four actual treatment paths. A radiologist who doesn’t understand the clinical implications of their words is a bad radiologist.
**This actually got me really nervous right after I posted the paper to arxiv (like, why has no-one thought of this?), so I email-bombed some friends for urgent feedback on the paper while I could still remove it from the processing list, but I got the all clear :p
*** I semi-justify this in the paper. It makes sense to me anyway.
^ Well, I will take credit for the phrase “Docs are ROCs”. Not gonna lie, it was coming up with that phrase that motivated me to write the paper. It just had to exist.
^^ For anyone interested, it still isn’t perfect. There are some reports of persistent underestimation of performance using SROC analysis in simulation studies. It also doesn’t really account for the fact most reader studies have a single set of cases, so the variance between cases is artificially low. But you can’t really get around that without making a bunch of assumptions (these are accurate empirical estimates), and it is tons better than what we do currently. And heck, it is good enough for Cochrane :p^^^
^^^ Of course, if you disagree with this approach, let me know. This is a preprint currently, and I would love to get feedback on why you hate it and everything about it, so I can update the paper or my friends list accordingly :p

Thank you for introducing the SROC. It’s very simple and intuitive, and I really love the SROC.
One comment. All dots on the ROC curve does not represent the performance of the algorithm. We usually set a threshold and the performance at the cut-off threshold is actually important. In a task that requires high sensitivity, the AUC value may be high just because the algorithm was good at the low-sensitivity areas. If we set a high sensitivity threshold, the AUC value may not represent the real performance of the algorithm.
To cope with the problem, I tried to calculate all Youden index (or F1 score) on the ROC curve, and then, the Youden index of each point was compared with that of physicians statistically (https://twitter.com/whria78/status/1336974263769653248/photo/1). If we will use an algorithm at specific thresholds, the performance at those points may be the most important.
Thank you. 🙂
LikeLike
Yes, comparing ROC-curves is purely a measure of discriminative performance. I generally advocate separating the two ideas: first test discriminative performance (where it is worth to compare with humans) and the estimate clinical performance (by picking a clinically relevant operating point).
The reason it makes no sense (to me) to use an operating point (and therefore sensitivity and specificity) to compare to doctors is we remain with a problem; which doctors? Look at all the examples here and in the paper – doctors are all over ROC space. There is just no reasonable way to pick a single “human operating point” for that comparison. You could use SROC analysis to pick the average point (most of the libraries offer this) but the operating point is hard to justify – it is neither a level that a real doctor performed at, nor is it a clinically useful point if you were going to choose one.
So for me, compare humans and AI on AUC, then pick a threshold for the AI and report the sensitivity and specificity (no comparison with humans needed).
LikeLike
Excellent points, all. I just want to add that this has applications that are far more general than AI comparisons. It would be interesting to use the same methodology to create SROCs of different clinics, readers with a certain level of experience etc.
LikeLike
Yeah I think this applies to the analysis of diagnostic tasks in general, except for the few that have scoring systems.
LikeLike
Luke, really like this. Would love to have a chat to you about some work we are doing with regard to skin cancer and variability in diagnosis (with Prof Tarl Prow from Adelaide). I will reach out on Linkedin
LikeLike
Have you looked at “When are summary ROC curves appropriate for diagnostic meta-analyses?” (https://pubmed.ncbi.nlm.nih.gov/19591118/)?
LikeLike
I have read it, I can’t see any problem they raise that is related to this use case though – docs always have threshold effects. While the sample sizes (of readers) can vary a lot, the current practice is to not acknowledge this at all in standard deviation calculations – doing anything at all is better than that!
The SD estimates look fairly reasonable as well, at least at face value.
LikeLike
Are you familiar with the free response paradigm? Looks like you are overlooking performance measurement at the abnormality level which is relevant to the clinical task.
ROC at the entire image (or case) level is appropriate in some situations and inappropriate in many. There are some significant limitations of ROC – such as a false positive localisation and a false negative localisation occurring in the same image that cannot be accounted for and is incorrectly coded as a true positive case. Mammography is an example of an inappropriate modality; a summary ROC curve is a summary of limited and inappropriate data.
See: https://doi.org/10.1118/1.1769352
Now FROC would be your “simple fix for a ‘methodologically indefensible’ practice”.
LikeLike
They just are useful in different situations. In many medical situations a binary response is fine, including mammography if it is being used as a screening modality.
LikeLike
Excellent post, I actually just ran into this same issue of arguing against “averaging of reader sensitivity/specificity” in a collaborative work of mine. My argument was based on nonlinear effects, i.e., average of a nonlinear function is not the same as the nonlinear function of an average. So taking the average Se/Sp is not the same as the Se/Sp of the average human reader, whatever the average human reader means. But you give a much better grounded explanation here.
LikeLike
Thanks Adam. That is well said: they are different things, and one is always an underestimate of the other!
LikeLike