

In a change of plans, today I am going to provide a bit of relief to the doctors and medical students reading this series. Instead of looking at regulation, I want to talk about the timelines of medical automation that came up last week. I’m going to flesh out those ideas a bit, because I think putting concrete dates to the predictions people make will be illuminating, particularly for doctors who are worried about their futures.
I will focus on radiology again today, just because I already have all the stats I need to do this. Feel free to extrapolate to other specialties.
For the purposes of today’s piece, as usual, we are not assessing the claim that deep learning can replace radiology. We will still get to that later in this series.
For today we will just accept as given that deep learning can replace radiology work. We will also accept as given that the estimates I made last week were roughly right, that about 70% of diagnostic radiology work is “at-risk” with these technologies. Finally, we will assume that the current slow growth of demand for radiologists will stay constant. This is the worst plausible scenario for radiology (because demand falling as prices drop is not a likely outcome).
The goal today will be to explore the future of radiology within these constraints, and I think this will show that even assuming the worst case scenario, it isn’t actually so bad for doctors 🙂
Standard disclaimer: these posts are aimed at a broad audience including layfolk, machine learning experts, doctors and others. Experts will likely feel that my treatment of their discipline is fairly superficial, but will hopefully find a lot of interesting a new ideas outside of their domains. That said, if there are any errors please let me know so I can make corrections.
Will robots take my job?
The biggest question I get asked by medicos is about their jobs. By far the most concerned group is students, particularly North American students who are facing down large student debts. They really want to know if their preferred specialty will be there by the time they finish training (often ten or more years in the future).
Since we aren’t talking about how likely automation is, it might seem strange that I think I can answer this question at all. But another way to look at this, which I touched on last week, is to estimate how fast automation will have to be to replace jobs for future doctors.
To explain this, we need to understand escape velocity.
Escape velocity is a term that comes from rocketry, and is defined as the lowest velocity needed to overcome the gravity of a planet and escape.

I don’t think “the relative speed of the clip-art rocket” is a good way to express this concept. I feel like it gives me the worst intuition – that Jupiter pulls on rockets less than Mercury.
There is a proper definition about the point where kinetic energy equals gravitational potential energy, but the concept itself can be applied to other things. The key idea is that there we are talking about systems with opposing forces; the thrust of the rockets has to overcome the pull of gravity.
This concept has been applied outside of physics. Most notably in relation to medicine are Aubrey de Grey’s ideas about life extension.
Living forever
Fun little diversion: Life expectancy is increasing. We have steadily gained about three years more life per decade for the last two centuries.

There are dips around wars and disasters, but the trend remains remarkably stable.
I personally think is the greatest single statistic in modern medicine. Many people erroneously believe that this statistic is not about longevity, because it is an average that includes child mortality. This is wrong – in the developed world we had minimised child mortality by the 50s. These days an infant has the same life expectancy as a twenty year old, give or take a year. Almost all of our gains since then have been in extending life in old age (including maximum lifespan), essentially by fixing the diseases that kill adults.

As you can see, life expectancy at birth and in adulthood has roughly converged
So where does escape velocity come into this? Well, we can look at aging as two opposing forces: the slow deterioration of the human body, and the scientific progress towards keeping us healthy.
At the moment we gain three years more life per decade. What would happen if science sped up, and we gained ten years per decade?
People could live nearly indefinitely.
This is called longevity escape velocity by some bio-gerontologists, and while this may sound ridiculous to many readers there is an enormous amount of interest in life extension research today. There are several drugs starting or already in human trials as I write this that could add a few years to healthy lifespans (metformin, rapamycin, and NMN are among the most likely near-term candidates).
I want to be clear though. I’m not actually arguing that I think longevity escape velocity is real, or that radical life extension is possible (another topic for another time). It is just a cool idea that helps us understand the escape velocity concept.
To end this little tangent, we can see that there is always a tipping point when we look at systems with counter-balancing forces. I think to understand automation, it will help to identify this with respect to radiology.
Radiology Escape Velocity
The counter-balancing forces in radiology, with respect to employment, are growth and automation.
Last week I noted that about five percent of the radiology workforce is filled by new graduates each year, and that radiology growth is around three percent annually (the other two percent is retirements). This means that we can displace five percent of radiologists each year and no-one currently practicing will lose their jobs (if we assume that no-one will be fired to hire a new graduate). However, if we are displacing at more than three percent annually then the radiology workforce will decrease through attrition.
Hopefully you can see that this is the radiology escape velocity: the minimum speed of automation where radiology starts to disappear as a profession.

Simplified* projections using UK data for workforce size and growth rate.
At the last census, there were a little over 3000 radiologists in the UK (you can multiply these numbers by ten for a rough estimate of the North American workforce). The current trend is for that number to double by 2050. The plot shows the transition points, where the workforce starts shrinking and where training of new radiologists becomes unnecessary.
This is actually quite reassuring to me, because it show us how incredibly fast automation will have to be before people start losing their jobs. This tipping point occurs at an automation rate of five percent per year. To put that in perspective, if we refer to my cheat sheet from last week, five percent of the workload is the equivalent of every CT chest at my hospital.
Even in the worst case scenario where the growth of imaging demand remains flat, for practicing radiologists to lose their jobs we need to automate the equivalent of all CT chest reporting each year.
Since we have currently automated exactly zero radiology tasks, that is pretty comforting. To make it even sweeter for the private practice radiologists out there, automation at the tipping point would mean increased profitability but no job losses.
“But,” I hear you say, “what about the med students who want to study radiology?”
Well the same tipping point applies. Training programs and employment might become more competitive with any level of automation, but unless we reach that five percent per year rate, training and jobs will still exist.
And remember that if you do get through training and get a job, the pace of automation would have to be very fast to displace you during your career.
This kind of analysis also tells us something interesting about radiology as a field. Even if we are automating radiology at a rate of five percent per year, in fifty years we will still have a thousand radiologists in the UK. That is roughly as large as the current ophthalmology workforce, and it is bigger than emergency medicine and dermatology.
That is worth repeating. According to this analysis, even if Geoffrey Hinton is spot on and we don’t need to train radiologists anymore, the College of Radiology will still be bigger in fifty years than many Colleges are today.
Now, this simplification is probably a bit optimistic. At the bottom of this piece I include a brief discussion* of some of the ways this could all be worse, but the main point is to show that even at high rates of automation there is a lag time which can mitigate the impact to current doctors and even future radiologists. It is a mistake to think that automation will occur overnight, even when everything lines up perfectly.
So the end of radiology isn’t going to be soon… unless the we get into the purple area of that graph (the ‘danger zone’). We will need to consider that in the next few parts of this series.
I decided to write this post after the article last week, mostly so I could refer back to it in future pieces. When we start looking at the evidence for how likely automation is, I think it will be helpful to keep in mind how far we are from radiology escape velocity.
Anyway, next week we should be talking about regulation, or maybe going through some recent studies. I haven’t quite decided on the order of the next posts yet.
See you then 🙂
* BLOG SUPPLEMENT 1
LIMITATIONS OF THIS ANALYSIS
This analysis is heavily simplified. Effects not accounted for include (but are not limited to):
-
The automation of tasks eating into growth in demand for radiologists. If a task is automated, even if demand increases for that task it still won’t be performed by doctors. Radiology progresses rapidly so there are new tasks introduced each year (which an automated system can’t perform), but this is not the majority of growth in demand.
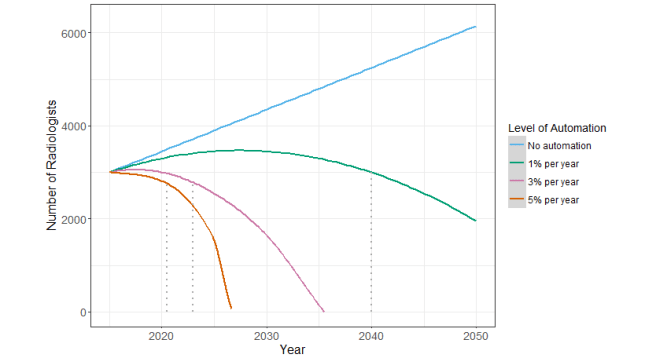 This plot assumes that zero new tasks are created each year (which is also unrealistic, the truth is probably somewhere in between). As a reference, 1% of all diagnostic work is equivalent to all of the cervical spine x-rays performed at my hospital. The dotted lines indicate the year where hiring stops and job losses begin (i.e., rate of loss > retirement rate).
 -
The shape of technological progress and adoption is not a straight line. Most economists model these trends as S-curves, which means initially slow progress can become much more rapid in a short space of time.

We are in phase 1 right now with deep learning, where the techniques are still being studied and improved upon.
-
The slowing rate of retirement. The census data shows a trend in this direction, although the cause is unclear. This doesn’t really affect the overall analysis, just the number of jobs available to new graduates.
-
Task substitution. Non-radiologists can take over radiology tasks, which might increase as sub-areas of radiology become more automated. This is plausible because many countries already have high levels of imaging reporting by non-radiologists.
-
I’ve already explicitly mentioned this, but demand for radiologist work could do anything. Demand usually increases as prices fall, and it is worth remembering that our current trend of 3% growth per year is historically low. But it could also stay flat or even go down, as we know the number of imaging studies performed has been falling in the last decade.
Posts in this series
Radiology Escape Velocity
Next post: Understanding Regulation

Fantastic stuff. Bookmarked.
LikeLike
to your point about tasks in the supplement:
isn’t the deal with software automation that when it takes over a task it will, immediately, take over 100% of it? for example, if we see breakthroughs reading foot x-rays and get better-than-doctor performance, then all foot x-ray work disappears instantly — rather than growing at a linear 3% automation/year, we’ll go 0% to 100% in that task as soon as proper approval comes in. additionally: at that point, aren’t the algorithmic techniques required to read foot x-rays at least somewhat transferrable to arm x-rays, etc.?
I mostly wonder whether the model should be that there’s a tipping point in our algorithms, research funding, etc. and once we hit that point we’ll be at a non-linearity in terms of replacing all tasks that have a certain set of properties. your second supplement point hints at this but I think that it really changes the assumptions of the 3% model, which is better for modeling a scenario where we introduced substitute robotic doctors gradually into the medical population who would slowly displace human doctors at increasing rates every year. the crazy property of software is that once it’s written, it can be instantly deployed everywhere at zero marginal cost — either it can’t read a foot x-ray or it will be reading every foot x-ray in the world, with very little in-between.
anyway, love the blog! one of my few subscriptions (and I always look forward to new posts) :). keep them coming!
LikeLike
Thanks Erik!
I don’t think I distinguished between tasks and jobs as well as I would have liked in this piece. You are right that we automate atomic tasks (whether that is “foot x-rays” or something even more fundamental), but each task is a fraction of the job.
Since we care about having jobs, the rates I am talking about are percentages of the total job (and each percentage point is made up of one or more tasks).
The sigmoid curve in the supplement does model non-linear progress, in that we reach some tipping point at the end of phase 1, and the is a much more rapid pace of automation in phase 2. For my simplified linear model, I am assuming that the rate (e.g 3% of the job of radiology automated per year) is occurring during phase 2 (i.e., at peak automation speed).
That said, the sigmoid curve is not just about progress, but also adoption. So it is not quite true that once a task is solved, it immediately disappears. In fact, most technologies only reach high penetration after a decade or more.
LikeLike
This is essentially a static argument, x% of tasks automated per year. I assert that we are in an exponential growth regime with machine learning, starting in about 2006 with a doubling period (of capability) of about 3 years. The accelerating capability means that as tasks begin to get automated, there will be a doubling of automated tasks. So, from the time we start at 1% it will take about 20 years (7 doublings) to have automated all.
Your sigmoid curve (2) does not work for exponential growth cases like Moore’s Law or Keck’s Law (b/s in optical fiber), or Cooper’s law (b/s for wireless). The tailing off of the sigmoid reflects the edges of the domain or diminishing returns.
LikeLike
Very good read!
I was just wondering on what your assumption “as we know the number of imaging studies performed has been falling in the last decade.” relies on, as OECD data for CT and MRI scans in Europe shows an increase.
Thanks!
LikeLike
It is oecd data, I’ll find my references for you when I get back to my computer. In most places the total number of scans has gone down, although individual modalities may still be going up.
We have definitely seen a shift away from plain films and towards cross sectional imaging, which is why the CT and MRI stats are against the overall trend in some parts of the world. I haven’t seen stats, but I wouldn’t be surprised if overall workload/effort has gone up while scan numbers have decreased. But the sudden change in the overall trend is still a big deal.
LikeLike