

Over the last couple of posts, we looked at the two research projects I consider to be true breakthroughs in medical AI, because they convincingly show us human-level performance at real and important medical tasks.
My claim that these papers were breakthroughs appears to be justified by the fact both groups appear to be testing these systems clinically within six months of the initial publication. The Google retinopathy group is actually finished with the initial clinical trials and is rolling out their system in India, seeking to address the major shortfall of trained ophthalmologists needed to deal with the growing epidemic of diabetic eye disease. The Stanford dermatology group is building a smartphone app to detect skin cancer.
I admit these transitions have come far quicker than I expected. I previously predicted that we will see several more research papers of similar quality this year, but that we would not have a clinical application. Google have proven me wrong there. Furthermore, since I wrote my post on regulation the FDA have partially updated their policies towards AI, reducing barriers to translation, and we have had a few deep learning systems obtain FDA approval (even if they are not really “clinical” systems). I’ll have to revise that post in the near future.
But while the pace of translation has been fast, the pace of proliferation has been slow. The two big papers came out within a month of each other, in December 2016 and January 2017. I predicted we would see another 3-5 similar papers this year, but so far there have been no further breakthroughs. Or maybe one, which occurred during the gap between my last blog post and this one. We will get to that next week.
What we have seen is many smaller papers, which don’t quite reach the same heights, but still tell us something very useful about medical AI, particularly if we are trying to predict the future of medicine. Today I want to look at a few of these papers, and glean what we can from them.
I will include another summary at the end, to draw together the various threads.
Standard disclaimer: these posts are aimed at a broad audience including layfolk, machine learning experts, doctors and others. Experts will likely feel that my treatment of their discipline is fairly superficial, but will hopefully find a some interesting new ideas outside of their domains. That said, if there are any errors please let me know so I can make corrections.
Where’s Wally?
Today we are talking about “proper” medical images – pathology and radiology. While retinal and skin photos are technically medical images, the images themselves don’t share a lot in common with those from radiology and pathology, which must account for over 99% of the total medical image volume we produce.
We will look at a few “almost there” papers that have come out this year, and what they can tell us about working with medical images.
We have already looked at image datasets a bit, but we haven’t really considered the images themselves. There is a problem with medical images. Well, not uniquely, but it is a major issue for those of us who work with medical data.
The images are just too damn big, and the things we care about are too damn small and too damn subtle.

Hi Wally! (/Waldo/Walter/Charlie/Holger/Effi …)
This is the “Where’s Wally” problem. The smaller Wally is, and the more Wally-alikes there are, the harder he is to find.
First up, the problem of subtlety. Lots of diseases look like normal tissue, just a tiny bit different. Like in the hardest Wally pictures where everything and everyone is coloured red and white; small, subtle variations make the difference between a right and wrong answer. You certainly wouldn’t want to discard 9 out of 10 pixels in the image, because then the features that make Wally unique from all the other stripy hat wearing people will disappear.
Which brings us to a paper on screening mammography.
High-Resolution Breast Cancer Screening with Multi-View Deep Convolutional Neural Networks
https://arxiv.org/abs/1703.07047
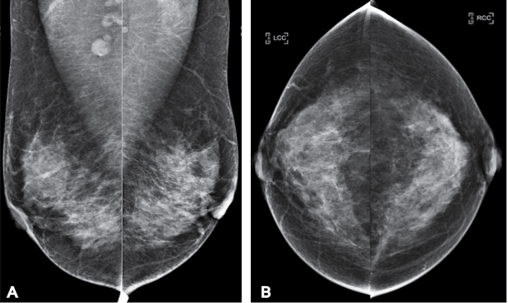
Examples of a screening mammography study. One patient, four pictures. One cancer, believe it or not. It isn’t the round bits at the top of A. It is the grey bit in the left breast that looks just like the rest of the grey bits. Mammography is hard and subtle.
This paper is interesting. The title kind of says everything we want to know – they are applying deep learning to look at mammograms with multiple different images per case, at high resolution, applied to a screening population.
This appears to target some of the possible weaknesses we raised with the previous papers:
- analysis of single images, when most medical tasks use multiple images.
- discarding most of the pixels in the images (>90%), and kind of just hoping useful information isn’t lost.
- training models on a non-clinical population (and the dermatology paper tested on a non-clinical population). The prevalence of disease in a screening population is super low, usually below 1%, which can make life hard for classification algorithms.
Before we explore these issues in the context of this paper, let’s have a look at what this paper was all about.
Task
They trained an AI system to classify mammograms into the clinical categories BI-RADS 0, 1 or 2. The BI-RADS scoring system is a structured method of estimating the risk of malignancy from mammograms, and is what almost all radiologists use. So far so good.
But BI-RADS is a scoring system from 0 to 5 (literally the one example where anyone but computer programmers use zero-indexing). Lesions concerning for malignancy are scored 3+. So they didn’t actually assess malignancy at all, they checked whether a scan was normal (1), had a “benign” lesion (2), or that the study was incomplete (0). Needless to say, this is not a particularly interesting clinical task, and it is not really clear that these groups are even well defined from a machine learning perspective.
Edit (8/11/17): Hi. I should have done this earlier, but I’m still a bit snowed under with work. Several readers have pointed out that my interpretation of the BI-RADS system was flawed. We don’t typically use this method in Australia. There is some nuance, but essentially the task the paper considers (BI-RADS 0 vs 1 vs 2) is a reasonable one. My complaint that BI-RADS 0 is a strange thing to teach an AI system was based on the idea that the category is for “technically incomplete” studies; those where the images were not of diagnostic quality. Instead BI-RADS 0 is mostly about “diagnostically incomplete” studies; cases where there is some suspicion of cancer, but further imaging is needed to make a sensible assessment. Essentially the category exists because the films are taken and the patient has gone home before the radiologist reviews them.
I should say that some resources suggest that BI-RADS 0 should be used sparingly, and the intention should always be to make a more definitive diagnosis at the time of the study. This would be much more like my experience in Australia. Where I work, the mammograms are given a score that relates to the risk of cancer on the mammogram alone, and a second score if/when further testing is performed.
I don’t understand the system as well as I would like, never having practiced using it, but I feel that this makes the screening BI-RADS system a pretty poor target for AI. The “at risk” category (BI-RADS 0) has an ill-defined risk of cancer, but it is probably less than 3%. I think most of what I have said below still makes sense, and the more general point still stands. I’ll talk about what constitute “good” and “bad” AI targets another time, but my gut feeling is that trying to replicate human labels here is not a great approach.
Data
They had 23,000 mammograms, so about one sixth of the two previous papers we looked at. Do note that they describe their dataset as over 100,000 images, but since each case has 4 or more images, that isn’t really a valid measure*. They actually only had 18,000 patients (some had more than one mammogram), but as long as they made sure the same patient didn’t end up in both the training and test sets, that is fine.
The major challenge they faced, however, is the prevalence of disease.

They had 3, 9 and 6.5 thousand training images in each of their groups. A bit unbalanced, but not too bad. But the prevalence of each category drops off rapidly after this. BI-RADS 3 has a prevalence of around 5-10%, BI-RADS 4 is less than 2%, and BI-RADS 5 is less than 1%. So if they had wanted to look at “suspicious for malignancy” cases, in 23,000 mammograms they would have only had 2000 examples, with less than 200 of these being highly suspicious.
To make matters worse, screening is generally sensitive but not specific. This means we favour false positives (doing biopsies in patients without cancer) over false negatives (missing cancer entirely). The prevalence of actual cancer in a screening populating is something like 0.3%, so they might have had 60 cases of breast cancer in their data.
I’ve said before that a good rule of thumb is that you need a thousand examples of something for deep learning to work well, and even then you will benefit a lot from more data. Recent research actually suggests that you will always benefit from more data, in a roughly logarithmic way.
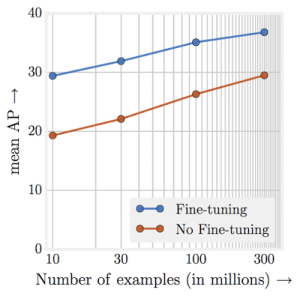
Performance just keeps going up, up, up with more data.
This all means that even big clinical datasets of over 20,000 cases are nowhere near big enough for building high quality predictive systems for most medical tasks. A disease prevalence of 0.3% in an clinical dataset is actually quite high, all things considered.
But we already knew we needed lots of data. What else can we learn from this paper?
Image size
This paper is really interesting for one particular reason – they used full sized mammograms, and even better, they tested the effects of shrinking the images.
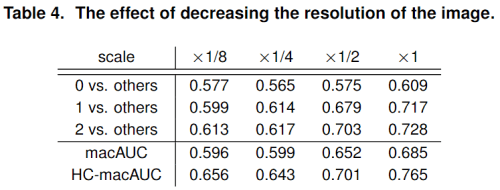
As you can see, there is a consistent trend of improving score with increasing image resolution.
For context, their mammograms were 2000 x 2000 pixels, or 4 megapixels. Their scaling applies in both directions, so their 1/8 scaling is roughly the size of the images we discussed over the last two weeks (250 x 250 pixels). You can see the performance difference is dramatic.
This is the biggest take home message from this paper for me. At least for mammography and in this unusual task, using full resolution images worked much better than using downsampled images. Shrinking hard Wally pictures is a bad idea.
This has two major implications, particularly if it is a general finding about radiology or medicine.
- The benefits of using systems pre-trained on millions of cat and dog pictures is not as obvious as we thought, if doing so forces us to discard 95% or more of the pixels.
- We need to work out how to feasibly train systems with such large images.
The second point is a big one because training a medical deep learning system is often limited by the amount of RAM on the video card. With small photographs and a large model, you might be able to fit a few hundred pictures on a cutting edge video card at one time. This is important, because you learn to improve the model on average across that set of images (we call this set a mini-batch, and the learning process is mini-batch stochastic gradient descent). But when the image is 4 megapixels, or worse a 3D scan is 20 megavoxels, or even worse a 4D scan is …
4D imaging is a time series of a 3D scan. This can result in hundreds or thousands of times more data than an equivalent 3D study.
Medical images can get absurdly large, giga-pixels/voxels/timey-wimey-voxels in scale. In our own work, we have often found that we can only fit in one or two “medium sized” examples per GPU, when using an average sized model.
This is solvable, with fancy tricks to reduce memory footprint, or with buckets of cash to use racks of GPUs (where you send one or two examples to each of dozens of video cards), but it is a barrier that most non-medical deep learning companies and researchers don’t have to deal with.
So at least with subtle Wallies, it pays to keep high resolution. But this has it’s own problems, because with enough resolution, Wally can be a tiny fraction of the image. Let’s consider this issue as we look at a paper that tries to find cancer in microscope slides.
Detecting Cancer Metastases on Gigapixel Pathology Images
https://arxiv.org/abs/1703.02442
If mammography is about looking for subtle Wallies, then histopathology is about finding a tiny Wally in a huge crowd.
There are a number of papers I could have used to talk about histology automation, but this one is both state-of-the-art or close to it, and covers some relevant issues for our discussion. In the paper, they try to identify clusters of cancerous cells in microscope slides of tissue from the lymph nodes taken out during breast cancer surgery. Other groups have worked with the same base dataset, check them out at the Camelyon16 challenge.
As an aside, this is another paper from Google. They are definitely at the leading edge of applying deep learning in medical image analysis right now. There is actually even an author overlap here with the retinopathy paper – Lily Peng, who has been doing super cool work with Google and has impeccable taste in blogs 🙂

I wonder if I can pull a Hinton and get the blog cited in peer-reviewed papers next?
Histology takes the problem of subtle findings in large images and jacks it up to eleven, with gigapixel images (as per the title) containing as few as a score of malignant cells.
In an ideal world, we would want to find even a single cancer cell in a slide of millions. A few dozen pixels in billions.
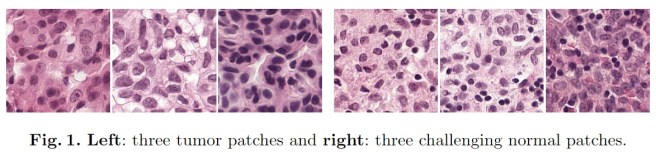
Needless to say, even humans aren’t great at this. It is also time-consuming to look through millions of pink cells for the also-pink ones that are just slightly wrong. Go back up to look at Figure 1 from this paper to see what I mean.
In the paper they quantify the difficulty of their task, which is the kind of information that isn’t always included but I really appreciate. They tell us that the percentage of each slide that contains tumour ranges from 0.01% to 70%, with a median of 2%. Not only that, these tumours aren’t all continuous, but instead are made up of many little clusters of cells. This is like picking out specific faces in a giant crowd of people, from a distance.
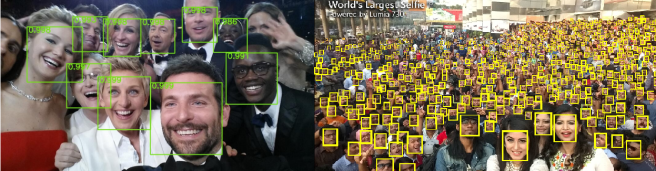
Even for humans, it gets pretty hard to identify tiny faces. If ImageNet is like the photo on the left, then histology analysis is like the photo on the right.
Let’s look for a second at how they dealt with this ridiculous task. They certainly couldn’t discard enough pixels to make training with gigapixel images manageable, considering each cell is only a few dozen pixels in size.
Their solution is to cut up the images into a grid of small patches that fit on GPUs and can be analysed at full resolution. A great idea, but there is a huge limitation here – you can only do this if your data is labelled at the patch level. Each cancer cluster has to be identified with location information. Usually this is some sort of bounding box, like the green and yellow boxes around the faces above. Without this level of detail you can’t identify which patch in a positive slide contains cancer.
So we come to the major problem with this approach. Doing bounding box labeling takes much longer than identifying positive cases alone. Double, triple, a hundred times as long or more. For an earlier project, I spent over an hour per case just labeling anatomy. This is why most medical datasets are so small; you just can’t find doctors willing to put in weeks or months of tedious labeling.
Which once again, as always, brings us to the data.
Data:
The reason this research wasn’t a “breakthrough” is simply because there isn’t enough data. They used a public dataset with 400 cases in total, 270 of which have bounding boxes for training. This leaves a test set of 130 cases. They also built a second test set of 110 cases from local clinical data, which again is very much best practice in medical research (a real world cohort drawn from a different patient set is pretty much required for any level of trust).
It is worth pointing out that while they only have 510 total cases, that is at the slide level. The system is trained on patches, and at the patch level they have 100,000 times that many samples. Instead of 88 cases with tumours for training, they end up with 870,000 patches containing tumour. This works for histology because cancer cells are location invariant; each patch has the same underlying chance of having cancer in it.
If the task was looking for appendicitis on an abdominal CT there would be no point making patches of the liver to increase the dataset size. The appendix is localised, so appendicitis almost never involves the liver. This means patch based training is only useful in limited situations, but when it is appropriate it is a great way to scale up a small dataset.
Results:
While this paper isn’t a “human-level breakthrough”, there are some interesting aspects of the results to point out.
![]()
Let’s look at the pathologist line of the results. These probably shouldn’t be in the same columns as the FROC and @8FP scores, because they aren’t the same thing. It says that with 30 hours to analyse through 130 cases, the pathologist detected 73% of all cancer clusters. But it looks like the AI system can detect around 93% of the tumourlets, in seconds. That seems like a huge win for the system, right?
Unfortunately there is a trade-off. Unlike the pathologist who never diagnosed cancer for a normal/healthy slide, the deep learning system generated 8 false positives per slide. This is the other aspect of the Where’s Wally problem rearing its head, and it is related to the prevalence issue we saw above and discussed in previous posts. Put simply, the prevalence of disease strongly affects how often you will over-call disease. Even if you identify all the positive cases correctly and misdiagnose a negative study once per 100 negative cases (sens = 1.0, spec = 0.99), if there are 100 negative examples per positive case then your diagnosis of disease will only be right 50% of the time!
This is true across datasets, but there is a similar effect within each image. Even if the false positive rate is very low, in this research they are making around 10,000 predictions per slide**. If anything, the fact the pathologist can operate with zero false positives is incredible, because it suggests a specificity of something like 0.9999…
Now, the Google team didn’t release their results at lower false positive rates, but we can look at the best results from the Camelyon16 challenge on the same data.

These are the results from the Harvard and MIT team who won the challenge. They had a lower FROC for patch level assessment than the Google paper does (by 10 points, which is a lot), but even so you can see that their sensitivity @0.25FPs is much lower than the pathologist managed with zero false positives.
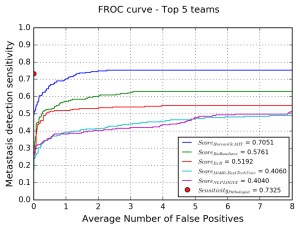
The blue line is the Harvard/MIT team, and you can see the sensitivity falls off rapidly as the number of false positives approaches zero. In fact, it looks like they only detect around 50% of cancer as they get close to zero false positives. The Google results will be better than this, but are probably still quite a bit below the pathologist.
Impact:
That doesn’t mean this system can’t be useful though, at least to my non-pathologist way of thinking. This is because computer models are more flexible than people: we get to choose an operating point. Humans each arrive at our own balance of overcalling and undercalling disease for any given task, and from there it is very hard to change.
Even if this system overcalls cancer, it does so in under a second. With a fair bit more data to increase that cancer detection rate above 99%, I can imagine a screening tool that highlights suspicious regions for the pathologists to review. Sure, some of those regions will be normal, but it could save time for our pathologist friends.
Because I always harp on about whether tasks are “clinical” or not, I did ask a pathology colleague about this one. They said that while it is something the do, a human expert will often use a second staining method as well (a cytokeratin antibody) which helps a lot. By forcing the human to just use the H+E stained slides, they are underestimating their performance. At the same time, they don’t usually spend 10-20 minutes on each slide, so there is an overestimate of human performance there as well.
My colleague also said that there is a fair amount of debate around the significance of small and tiny tumour clusters (<2mm and <0.2mm), with some groups believing they rarely lead to disease recurrence. The system described in the paper had 100% FROC when identifying metastases above 2mm, so it might already be near-perfect at identifying clinically important disease.
Not a prize hound, but still a very good dog

The papers we have looked at today haven’t achieved human level performance. In the first example, they didn’t even attempt a useful clinical task. In the second case, they created a system that might end up being useful (and possibly displacing some pathologist work), even if it can’t do what human experts do.
But even if these papers aren’t “breakthroughs”, they tell us something about where we are right now with medical AI. We are in a place where the low prevalence of disease and the giant images we currently use are a bit of a stumbling block. There are solutions, including many we haven’t covered here, but as yet no-one has published on a system with human-level performance at a clinical task using full sized images with small or subtle findings.
Of course, many groups are working on it. It might even be the case that certain blog authors have a reason for not blogging for a little while, and could be revealing more sometime soon 🙂
Next post I will take a look at one more paper that has come out recently, titled “Cardiologist-Level Arrhythmia Detection with Convolutional Neural Networks“. Maybe finally we will have an answer for the critics who say that “medical AI is rubbish, it can’t even read ECGs.”
See you next time.
SUMMARY/TL:DR
- Medical imaging poses specific problems that most other image analysis AI doesn’t have to overcome. One of them is the “Where’s Wally” problem; images are often enormous, and the features of disease are often small and subtle.
- In medical tasks, shrinking the images by discarding pixels can hurt performance, which means pre-training isn’t applicable.
- Huge images pose a technical challenge, because the hardware of deep learning struggles to cope with them.
- One way to solve these challenges is by patch based training, but this increases the time and cost of dataset collection by orders of magnitude.
- The low rate of disease in clinical populations means we often need enormous datasets to find enough positive cases. This increases costs dramatically as well, if the datasets even exist.
- Medical AI systems are more flexible than human experts in some specific ways, and might be useful even if they aren’t quite at human level.
*This is a bit of a pet peeve of mine. I could have said in my recent proof of concept paper built on CT images from 48 patients “was trained on a dataset of over 4000 images”, but that doesn’t reflect the amount of training data available. It learned about 48 things, so that is the right number to report.
**While this is explicitly true with patch-based training, I’d suggest a similar effect is causing problems for the analysis of most medical images, where the abnormality to detect is only a small fraction of the total image. Conceptually, not only do the learned features have to identify disease but they need to not activate for any other non-pathological structure.
Posts in this series
Other deep learning papers of interest
Next: Stanford and cardiology

You don’t happen to post on AuntMinnie by some chance, do you?
LikeLike
No, I do read there sometimes but I don’t think I’ve ever posted. Is there a conversation I should be following?
LikeLike
Perhaps you should. The discussion of AI in radiology plods on there, with one fellow absolutely adamant that AI will replace radiologists in a few years. He’s scaring the med students who might otherwise go into imaging. Do have a look. I would appreciate your perspective.
LikeLike
Yeah … it kind of just feels like a couple of people arguing about the same things, with no hope of convincing each other. Both sides of the argument are pretty extreme.
LikeLike
Hey Luke,
I enjoy reading your blog. Minor comment but you may find useful. Regarding the mammogram paper, you mention that this is not a clinically important topic they’re addressing since it was just to see BIRADS 0,1, or 2 and the classification is actually 0-6. But this actually is clinical useful.
The birads 3-6 categories are only applied to “diagnostic mammograms”; this is when additional views are taken with different angles, magnifications and using focal compressions in an area of interest. BIRADS 0-2 are the designations applied to screening mammography and so when receiving a stack of 200 mammograms a radiologist goes through each case and assigns 0,1, or 2 and if 0 the patient comes back at a later date for further imaging which then receives a 0-5. So an algorithm that could screen through a stack of mammos and pick out the 0s, would allow doctors to only evaluate the questionable ones, which is a 10th of them and this would actually be extremely useful clinically.
LikeLike
Just to let you know, I have updated the post to address this. Thanks for the feedback (and for the other readers who raised the same issue in other places).
LikeLike
I believe the game is called “Where’s Waldo”.
LikeLike